|

CALIFORNIA'S CONTRIBUTIONS TO MODERN MAPPING
In the past 50 years mapping has come a long way. The advent of remote sensing from aircraft and satellites, the ability to measure position almost instantaneously anywhere on the face of the Earth, and digital technology enabling image processing and GIS have transformed the concept of mapping. Now we are not limited to the surface of the Earth as we extend our surveys undersea and to the outer reaches of space. So we include mapping the solar system and space in our view of the field. With the latest software and the internet we are able to replicate much of the modern mapping right in our homes with “DIY” (Do-It-Yourself) mapping. Californians and California businesses and institutions have played a central role in the development of modern mapping. In this section we highlight a few examples now and will keep adding to them as the story evolves. In the maps and stories section, some of these will be explored in further detail. But for now, here are a few thumbnails of California’s contributions.
For the US, paper 7.5 minute topographic maps, called quads, produced by the USGS were the standard for decades. The technology for producing them was first modernized by the Western Geographic Map Center in Menlo Park, California. Being in Silicon Valley and sensitive to the advances of digital technology in the 1970s and 80s, the Center developed the process for digitizing the quads and joining them together into a seamless map display. Today you can download a quad from the USGS to your desktop and select the portion you want for your purposes as in the example to the right of the segment covering Yosemite Valley. No one organization has more clearly defined GIS than ESRI in Redlands, California. One survey estimates that 80% of the GIS professionals world-wide use ESRI’s products in performing their work and GIS is often used for mapping now.
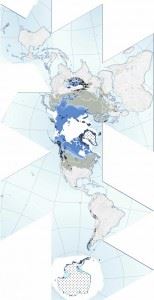
Here’s one example from ESRI’s annual Map Book by researchers in Norway who mapped the cryosphere using ESRI’s ArcGIS Desktop 9.2 to better understand our climate. It shows the Earth’s snow and various forms of ice which play different roles in our climatic systems. The two continental ice sheets of Antarctica and Greenland actively influence the global climate over time scales of millennia to millions of years but may also have more rapid effects on environmental sea level. Snow and sea ice, with their large areas but relatively small volumes, are connected to key interactions and feedbacks at global scales, including solar reflectivity and ocean circulation. Perennially frozen ground (permafrost) influences soil water content and vegetation over vast regions and is one of the cryosphere components most sensitive to atmospheric warming trends. As permafrost warms, organic material stored in permafrost may release greenhouse gases into the atmosphere and increase the rate of global warming. Glaciers and ice caps, as well as river and lake ice, with their smaller areas and volumes, react relatively quickly to climate effects, influencing ecosystems and human activities on a local scale, and act as good indicators of climate change.
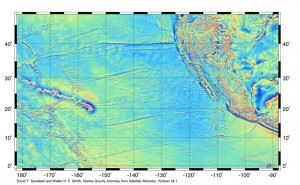
San Diego has been a hub of oceanographic research for over 100 years. In 1960 submersible, Trieste, from San Diego took two explorers to the bottom of the Challenger Deep, 35,797 feet below the surface, the deepest point ever surveyed in the Earth’s oceans. No one has gone so far below ever since. Such charting the depths of our oceans, bathymetry, is a slow process even using the traditional tools and techniques of soundings and sonar. A geophysicist, Dr. David Sandwell, at Scripps Institution of Oceanography in San Diego, California, with another researcher at NOAA came up with a better idea. They realized that declassified radar altimetry data from the GEOSAT and ERS-1 satellites could be used to produce global bathymetry maps. The variation in the satellite altitudes is caused by variations in gravity due to the elevation of the sea floor below. Now all the Earth’s oceans have been mapped and you can access the results on the internet and Google Earth – another California creation.
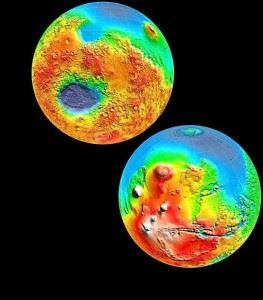
Since we are exhausting the places on Earth to explore and map, we’ve turned our attention to the Moon and planets. The center of planetary exploration has been the Jet Propulsion Laboratory (JPL), part of Caltech, in Pasadena, California. Renowned for its robotic extraterrestrial explorers, JPL has led the mapping of the planets. JPL’s Mars Global Surveyor (MGS) remotely sensed the planet from orbit from 1997 through 2006 and was the first to identify a history of water in its geology. MGS circled Mars in a polar orbit once every two hours collecting global "snapshots" from ~250 miles above the Martian surface. It revealed new information on weather patterns, geological features and the migration of water vapor. The spacecraft's laser altimeter gave scientists their first 3-D views of the rugged topography of Mars shown in these maps of the two hemispheres of Mars displayed on the cover of Science magazine. Now you can see Mars yourself thanks to this data on the new Google Mars.
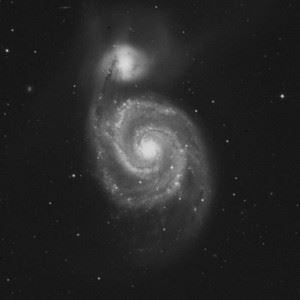
Before we could get up close to these astronomical sights, another part of Caltech, the Mount Palomar Observatory in north San Diego County performed the very first modern survey and mapping of the skies in the 50s. Its Palomar Observatory Sky Survey (POSS) recorded on high resolution film with the 200-inch Hale telescope is the baseline map of the skies still used today. Later a POSSII was performed and the data has been digitized into DPOSS (Digital POSS) which is now used for Google Sky’s images of the universe. Images such as these from the survey can be downloaded directly from the internet for almost any sector of the sky.
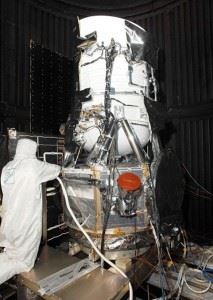
But now we’re going a step further with the launch of WISE, the Wide-field Infrared Survey Explorer, in December, 2009. Launched from California’sVandenberg Air Force Base, the mission is managed byJ PL, the data is processed by Caltech, UCLA’s Edward Wright is the principle investigator, and UC Berkeley is responsible for education and outreach. WISE will provide an all-sky infra-red survey to help search for the origins of planets, stars, and galaxies and create an infrared atlas in far greater detail than ever made before. Its findings will range from detection of asteroids larger than 3 km in size in the Main Belt to finding the closest star to the sun as well as the most luminous galaxies in the Universe. |
|

 Image 1
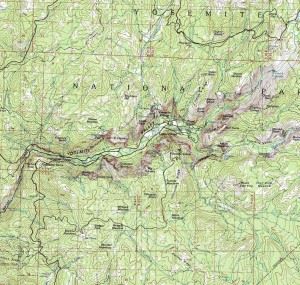 Image 2